Table of Results
Contents
Key Stage 2
Meaning
A Table of Results is a way to write the observations and measurements taking during an investigation to make them easier for others to read
Examples
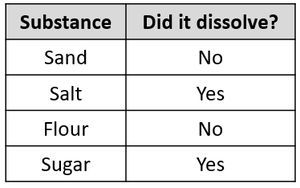
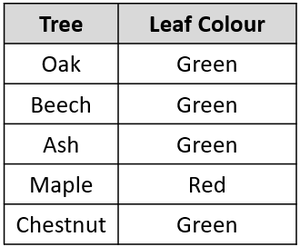
| These are the results from an experiment to see which substances dissolve. | An investigation into the colour of different tree's leaves gave these results. |
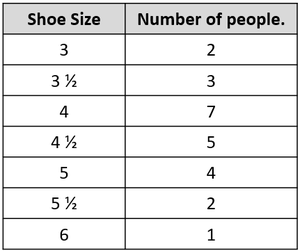
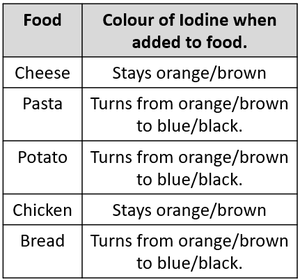
| The results from an investigation into the number of people with each shoe size in class. | The results from adding iodine to different foods. |
Key Stage 3
Meaning
A Table of Results is a way to order the observations and measurements taken during an investigation to make them easier to write and present to others.
About Tables of Results
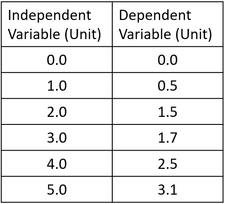
- In a table of results the independent variable goes on the left hand column and the dependent variable goes on the right.
- A table of results does not usually include a control variable as it would just be repeated in one column.
- The top row of a table of results includes a description of the quantity in that column.
- If a column includes results that were measured then the top row will also include the units for that measurement.
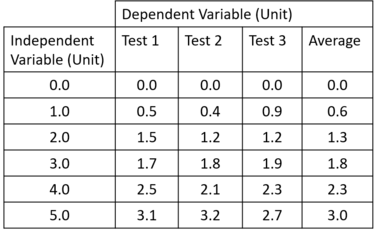
- Tables of Results are also used for simple data processing such as calculating an average from repeats of an experiment.
| This table of results shows how the Independent Variable is in the left column and the Dependent Variable is in the right column. | This table of results shows how the Independent Variable is in the left column with repeats labelled "Test 1", "Test 2" and "Test 3" with the average calculated on the right. |
Key Stage 4
Meaning
A Table of Results is a way to order the observations and measurements taken during an investigation to make them easier to write and present to others.
About Tables of Results
- In a table of results the independent variable goes on the left hand column and the dependent variable goes on the right.
- A table of results does not usually include a control variable as it would just be repeated in one column.
- The top row of a table of results includes a description of the quantity in that column.
- If a column includes results that were measured then the top row will also include the units for that measurement.
- Tables of Results are also used for simple data processing such as calculating an average from repeats of an experiment.
| This table of results shows how the Independent Variable is in the left column and the Dependent Variable is in the right column. | This table of results shows how the Independent Variable is in the left column with repeats labelled "Test 1", "Test 2" and "Test 3" with the average calculated on the right. |
