Difference between revisions of "Anomaly"
| Line 1: | Line 1: | ||
==Key Stage 3== | ==Key Stage 3== | ||
| + | ===Meaning=== | ||
| + | An '''anomaly''' is an unusual [[Results|result]] that does not fit the pattern formed by the rest of the [[results]]. | ||
| + | |||
| + | ===About Anomalies=== | ||
| + | : '''Anomalies''' may be caused by [[Experimental Error|experimental errors]] such as an [[Control Variable|uncontrolled variable]]. | ||
| + | : An [[anomaly]] can be spotted by looking for a pattern in the [[results]] and any [[results]] that don't fit that pattern. | ||
| + | : An [[anomaly]] may become clear from a [[graph]] of [[results]] where it is easier to see the pattern. | ||
| + | |||
| + | ===Examples=== | ||
| + | {| class="wikitable" | ||
| + | |- | ||
| + | |[[File:AnomalousResult1.png|center|225px]] | ||
| + | |[[File:AnomalousResult2.png|center|375px]] | ||
| + | |- | ||
| + | | style="height:20px; width:200px; text-align:center;" |The '''anomalous''' result, circled in red, can be spotted because it doesn't fit the pattern of increasing by around 0.6 each time. | ||
| + | | style="height:20px; width:200px; text-align:center;" |The '''anomalous''' result, circled in red, can be spotted because it is higher than all the other results in the row. | ||
| + | |} | ||
| + | |||
| + | ==Key Stage 4== | ||
===Meaning=== | ===Meaning=== | ||
An '''anomaly''' is an unusual [[Results|result]] that does not fit the pattern formed by the rest of the [[results]]. | An '''anomaly''' is an unusual [[Results|result]] that does not fit the pattern formed by the rest of the [[results]]. | ||
Revision as of 18:13, 21 March 2019
Contents
Key Stage 3
Meaning
An anomaly is an unusual result that does not fit the pattern formed by the rest of the results.
About Anomalies
- Anomalies may be caused by experimental errors such as an uncontrolled variable.
- An anomaly can be spotted by looking for a pattern in the results and any results that don't fit that pattern.
- An anomaly may become clear from a graph of results where it is easier to see the pattern.
Examples
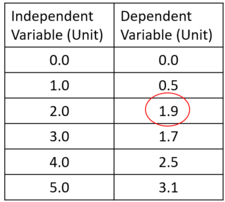
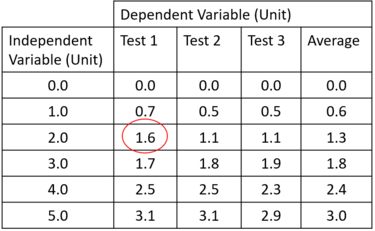
| The anomalous result, circled in red, can be spotted because it doesn't fit the pattern of increasing by around 0.6 each time. | The anomalous result, circled in red, can be spotted because it is higher than all the other results in the row. |
Key Stage 4
Meaning
An anomaly is an unusual result that does not fit the pattern formed by the rest of the results.
About Anomalies
- Anomalies may be caused by experimental errors such as an uncontrolled variable.
- An anomaly can be spotted by looking for a pattern in the results and any results that don't fit that pattern.
- An anomaly may become clear from a graph of results where it is easier to see the pattern.
Examples
| The anomalous result, circled in red, can be spotted because it doesn't fit the pattern of increasing by around 0.6 each time. | The anomalous result, circled in red, can be spotted because it is higher than all the other results in the row. |

