Difference between revisions of "Anomaly"
(→Key Stage 4) |
|||
| Line 36: | Line 36: | ||
| style="height:20px; width:200px; text-align:center;" |The '''anomalous''' result, circled in red, can be spotted because it is higher than all the other results in the row. | | style="height:20px; width:200px; text-align:center;" |The '''anomalous''' result, circled in red, can be spotted because it is higher than all the other results in the row. | ||
|} | |} | ||
| + | |||
| + | ===References=== | ||
| + | ====AQA==== | ||
| + | :[https://www.amazon.co.uk/gp/product/019835939X/ref=as_li_tl?ie=UTF8&camp=1634&creative=6738&creativeASIN=019835939X&linkCode=as2&tag=nrjc-21&linkId=57e96876985fc39b1a3d8a3e3dc238b6 ''Anomalies, page 283, GCSE Physics; Third Edition, Oxford University Press, AQA'] | ||
| + | :[https://www.amazon.co.uk/gp/product/0198359381/ref=as_li_tl?ie=UTF8&camp=1634&creative=6738&creativeASIN=0198359381&linkCode=as2&tag=nrjc-21&linkId=47c8d1ae58d8b3a5e2094cd447154558 ''Anomalies, pages 267, 270, GCSE Chemistry; Third Edition, Oxford University Press, AQA'] | ||
Revision as of 18:32, 27 October 2019
Contents
Key Stage 3
Meaning
An anomaly is an unusual result that does not fit the pattern formed by the rest of the results.
About Anomalies
- Anomalies may be caused by experimental errors such as an uncontrolled variable.
- An anomaly can be spotted by looking for a pattern in the results and any results that don't fit that pattern.
- An anomaly may become clear from a graph of results where it is easier to see the pattern.
Examples
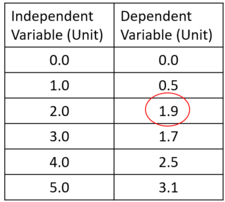
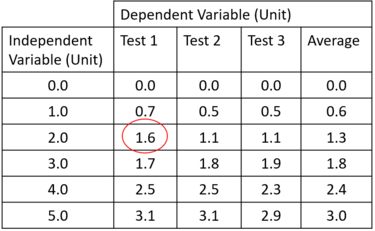
| The anomalous result, circled in red, can be spotted because it doesn't fit the pattern of increasing by around 0.6 each time. | The anomalous result, circled in red, can be spotted because it is higher than all the other results in the row. |
Key Stage 4
Meaning
An anomaly is an unusual result that does not fit the pattern formed by the rest of the results.
About Anomalies
- Anomalies may be caused by experimental errors such as an uncontrolled variable.
- An anomaly can be spotted by looking for a pattern in the results and any results that don't fit that pattern.
- An anomaly may become clear from a graph of results where it is easier to see the pattern.
Examples
| The anomalous result, circled in red, can be spotted because it doesn't fit the pattern of increasing by around 0.6 each time. | The anomalous result, circled in red, can be spotted because it is higher than all the other results in the row. |

