Difference between revisions of "Line Graph"
(Created page with "==Key Stage 2== ===Meaning=== A '''line graph''' is a graph where you join the points with straight lines. ===About Line Graphs=== : Line graphs are used to show changes over...") |
|||
| Line 5: | Line 5: | ||
===About Line Graphs=== | ===About Line Graphs=== | ||
: Line graphs are used to show changes over time. | : Line graphs are used to show changes over time. | ||
| − | : | + | : Time is always plotted on the x-axis. |
| + | : The [[variable]] that is being counted or measured goes on the y-axis. | ||
| + | |||
| + | ===Drawing a Line Graph=== | ||
| + | {| class="wikitable" | ||
| + | |- | ||
| + | |[[File:LineGraphTable.png|center|200px]] | ||
| + | |[[File:LineGraphPt1.png|center|200px]] | ||
| + | |- | ||
| + | | style="height:20px; width:200px; text-align:center;" |Text | ||
| + | | style="height:20px; width:200px; text-align:center;" |Text | ||
| + | |- | ||
| + | |[[File:LineGraphPt2.png|center|200px]] | ||
| + | |[[File:LineGraphPt3.png|center|200px]] | ||
| + | |- | ||
| + | | style="height:20px; width:200px; text-align:center;" |Text | ||
| + | | style="height:20px; width:200px; text-align:center;" |Text | ||
| + | |} | ||
Revision as of 09:18, 22 August 2018
Key Stage 2
Meaning
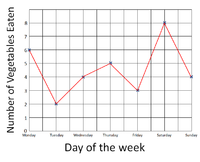
A line graph is a graph where you join the points with straight lines.
About Line Graphs
- Line graphs are used to show changes over time.
- Time is always plotted on the x-axis.
- The variable that is being counted or measured goes on the y-axis.
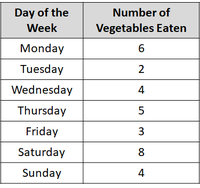
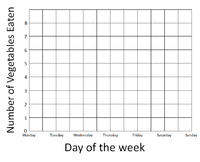
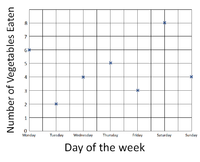
Drawing a Line Graph
| Text | Text |
| Text | Text |


