Difference between revisions of "Pyramid of Biomass"
(→Examples) |
|||
| Line 10: | Line 10: | ||
{| class="wikitable" | {| class="wikitable" | ||
|- | |- | ||
| − | |[[File: | + | |[[File:PyramidofBiomass.png|center|500px]] |
|- | |- | ||
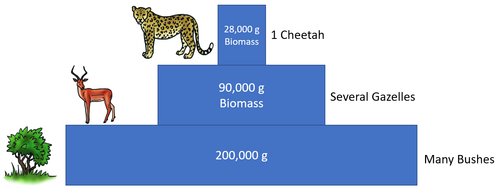
| style="height:20px; width:200px; text-align:center;" |This '''pyramid of biomass''' shows the [[biomass]] of gazelles and bushes in a [[community]] needed to support just one [[cheetah]]. | | style="height:20px; width:200px; text-align:center;" |This '''pyramid of biomass''' shows the [[biomass]] of gazelles and bushes in a [[community]] needed to support just one [[cheetah]]. | ||
|} | |} | ||
Revision as of 10:59, 18 November 2018
Key Stage 4
Meaning
A pyramid of biomass is a diagram used to show the relative amounts of biomass between different trophic levels in a food chain.
About Pyramids of Biomass
- There is always far greater biomass in the first trophic level (producers).
- The amount of biomass in each trophic level in a community decreases as the trophic level increases.
Examples
| This pyramid of biomass shows the biomass of gazelles and bushes in a community needed to support just one cheetah. |
