Difference between revisions of "Bar Chart"
(→Examples) |
|||
| Line 3: | Line 3: | ||
A '''Bar Chart''' is a type of graph used to compare data. | A '''Bar Chart''' is a type of graph used to compare data. | ||
===About Bar Charts=== | ===About Bar Charts=== | ||
| − | : '''Bar Charts''' are used when you are comparing two or more numbers in a category. | + | : '''Bar Charts''' are used when you are comparing two or more numbers in a category. |
| + | : The category you choose should go on the bottom of the '''bar chart'''. | ||
| + | : What you count or measure should go up the side of the '''bar chart''' | ||
: The bars in a '''bar chart''' should not be touching. | : The bars in a '''bar chart''' should not be touching. | ||
===Examples=== | ===Examples=== | ||
Revision as of 13:19, 20 August 2018
Key Stage 2
Meaning
A Bar Chart is a type of graph used to compare data.
About Bar Charts
- Bar Charts are used when you are comparing two or more numbers in a category.
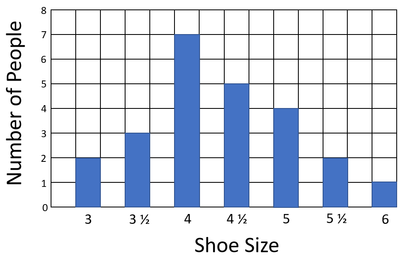
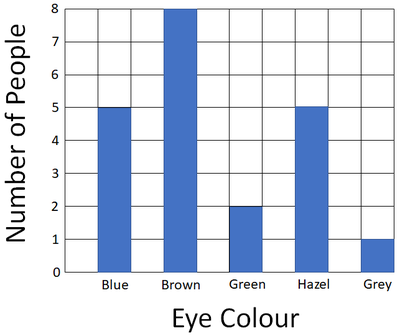
- The category you choose should go on the bottom of the bar chart.
- What you count or measure should go up the side of the bar chart
- The bars in a bar chart should not be touching.
Examples
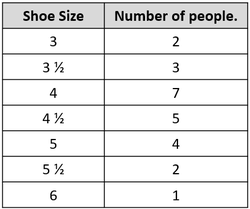
| Results table for the bar chart. | A bar chart comparing the numbers of people with each shoe size in a class. |
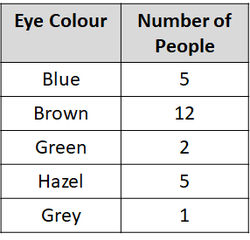
| Results table for the bar chart. | A bar chart comparing the numbers of people with different eye colour in a class. |


