Contents
Key Stage 2
Meaning
A Bar Chart is a type of graph used to compare data.
About Bar Charts
- Bar Charts are used when you are comparing two or more numbers in a category.
- The category you choose should go on the bottom of the bar chart.
- What you count or measure should go up the side of the bar chart
- The bars in a bar chart should not be touching.
Examples
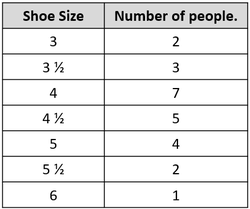
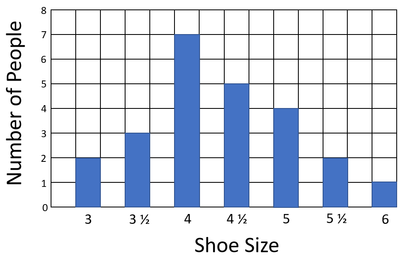
| Results table for the bar chart. | A bar chart comparing the numbers of people with each shoe size in a class. |
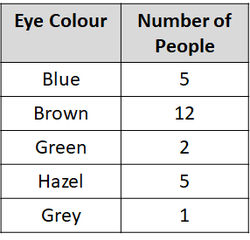
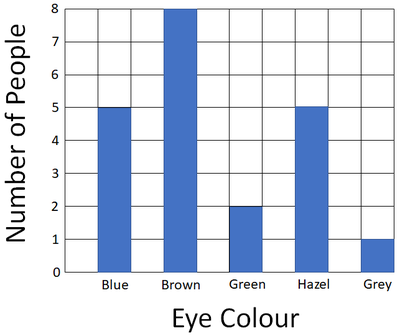
| Results table for the bar chart. | A bar chart comparing the numbers of people with different eye colour in a class. |
Key Stage 3
Meaning
A Bar Chart is a type of graph used to compare categoric variables.
About Bar Charts
- Bar Charts are used when you are comparing two or more numbers in a category.
- The category is the independent variable in an investigation.
- The dependent variable is a number in the category.
- The categoric variable goes on the x-axis of a bar chart.
- The number counted or measured should go on the y-axis of the bar chart
- The bars in a bar chart should not be touching.


