Key Stage 3
Meaning
A pie chart is a circular graph which is divided into slices where each slice represents a proportion of the whole.
About Pie Charts
- Pie charts make it easier to compare the size of different fractions.
Examples
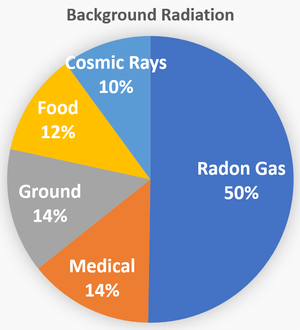
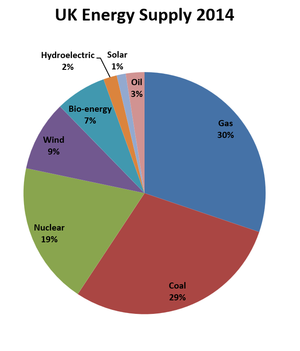
| A pie chart showing the sources of dangerous radiation humans are exposed to. | A pie chart showing the different sources of electricity for the United Kingdom in 2014. |

