Difference between revisions of "Positive Correlation"
(Created page with "==Key Stage 3== ===Meaning=== A '''positive correlation''' is when one variable increases while the other variable increases. {| class="wikitable" |- |File:Positive...") |
|||
| Line 6: | Line 6: | ||
|- | |- | ||
|[[File:PositiveCorrelation.png|center|500px]] | |[[File:PositiveCorrelation.png|center|500px]] | ||
| + | |- | ||
| + | | style="height:20px; width:200px; text-align:center;" |This [[Scatter Graph|scatter graph]] shows a '''positive correlation'''. | ||
| + | |} | ||
| + | |||
| + | ==Key Stage 3==4 | ||
| + | ===Meaning=== | ||
| + | A '''positive correlation''' is when one [[variable]] increases while the other [[variable]] increases. | ||
| + | |||
| + | {| class="wikitable" | ||
| + | |- | ||
| + | |[[File:PositiveGradient.png|center|500px]] | ||
|- | |- | ||
| style="height:20px; width:200px; text-align:center;" |This [[Scatter Graph|scatter graph]] shows a '''positive correlation'''. | | style="height:20px; width:200px; text-align:center;" |This [[Scatter Graph|scatter graph]] shows a '''positive correlation'''. | ||
|} | |} | ||
Revision as of 10:43, 25 March 2019
Key Stage 3
Meaning
A positive correlation is when one variable increases while the other variable increases.
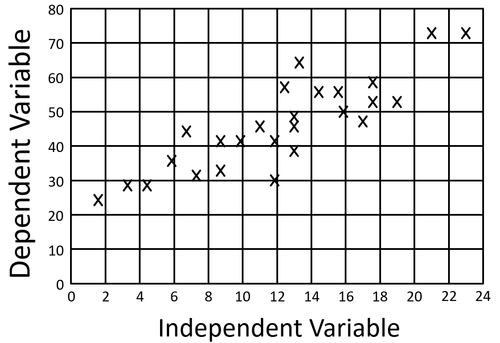
| This scatter graph shows a positive correlation. |
==Key Stage 3==4
Meaning
A positive correlation is when one variable increases while the other variable increases.
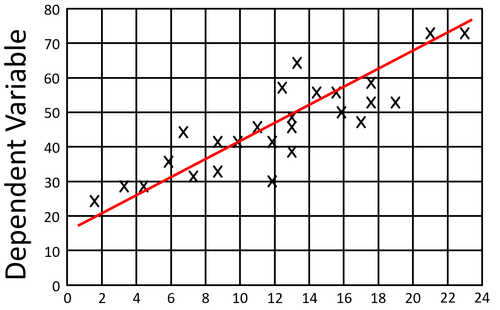
| This scatter graph shows a positive correlation. |

