Key Stage 2
Meaning
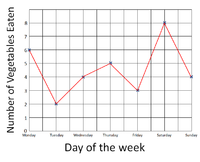
A line graph is a graph where you join the points with straight lines.
About Line Graphs
- Line graphs are used to show changes over time.
- Time is always plotted on the x-axis.
- The variable that is being counted or measured goes on the y-axis.
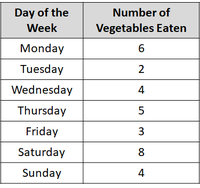
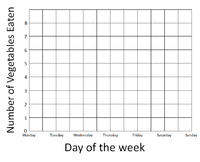
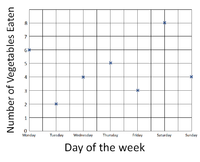
Drawing a Line Graph
| Text | Text |
| Text | Text |


