Difference between revisions of "Line of Best Fit"
| Line 13: | Line 13: | ||
|- | |- | ||
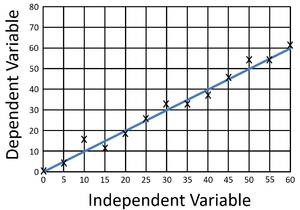
| style="height:20px; width:200px; text-align:center;" |This [[Scatter Graph|scatter graph]] shows a straight [[Line of Best Fit|line of best fit]]. | | style="height:20px; width:200px; text-align:center;" |This [[Scatter Graph|scatter graph]] shows a straight [[Line of Best Fit|line of best fit]]. | ||
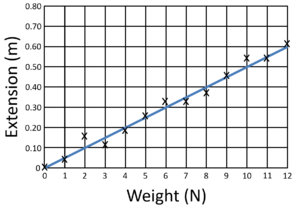
| + | | style="height:20px; width:200px; text-align:center;" |This [[Scatter Graph|scatter graph]] of [[Extension]] against [[Weight]] results in a straight [[Line of Best Fit|line of best fit]]. | ||
| + | |- | ||
| + | |[[File:ScatterGraphCurve.png|center|300px]] | ||
| + | |[[File:ScatterGraphCurve2.png|center|300px]] | ||
| + | |- | ||
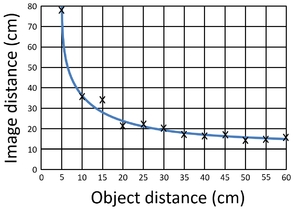
| + | | style="height:20px; width:200px; text-align:center;" |This [[Scatter Graph|scatter graph]] of [[Image Distance]] against [[Object Distance]] of a [[Lens]] results in a curved [[Line of Best Fit|line of best fit]]. | ||
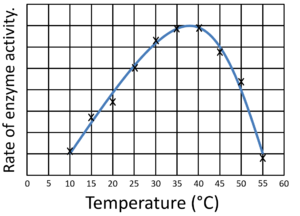
| + | | style="height:20px; width:200px; text-align:center;" |This [[Scatter Graph|scatter graph]] showing how [[temperature]] affects [[enzyme]] activity results in a curved [[Line of Best Fit|line of best fit]]. | ||
| + | |} | ||
| + | |||
| + | ==Key Stage 4== | ||
| + | ===Meaning=== | ||
| + | A '''line of best fit''' is drawn on a [[Scatter Graph]] to fit the trend. | ||
| + | |||
| + | ===About Lines of Best Fit=== | ||
| + | : A '''line of best fit''' may be a straight line or a curve depending on how the points are arranged on the [[Scatter Graph]]. | ||
| + | |||
| + | ===Examples=== | ||
| + | {| class="wikitable" | ||
| + | |- | ||
| + | |[[File:ScatterGraphVariables.png|center|300px]] | ||
| + | |[[File:ScatterGraphStraight.png|center|300px]] | ||
| + | |- | ||
| + | | style="height:20px; width:200px; text-align:center;" |This [[Scatter Graph|scatter graph]] shows a straight [[Line of Best Fit|line of best fit]] that crosses through zero showing the [[variable]]s are [[Directly Proportional|directly proportional]]. | ||
| style="height:20px; width:200px; text-align:center;" |This [[Scatter Graph|scatter graph]] of [[Extension]] against [[Weight]] results in a straight [[Line of Best Fit|line of best fit]]. | | style="height:20px; width:200px; text-align:center;" |This [[Scatter Graph|scatter graph]] of [[Extension]] against [[Weight]] results in a straight [[Line of Best Fit|line of best fit]]. | ||
|- | |- | ||
Revision as of 12:00, 22 March 2019
Contents
Key Stage 3
Meaning
A line of best fit is drawn on a Scatter Graph to fit the trend.
About Lines of Best Fit
- A line of best fit may be a straight line or a curve depending on how the points are arranged on the Scatter Graph.
Examples
| This scatter graph shows a straight line of best fit. | This scatter graph of Extension against Weight results in a straight line of best fit. |
| This scatter graph of Image Distance against Object Distance of a Lens results in a curved line of best fit. | This scatter graph showing how temperature affects enzyme activity results in a curved line of best fit. |
Key Stage 4
Meaning
A line of best fit is drawn on a Scatter Graph to fit the trend.
About Lines of Best Fit
- A line of best fit may be a straight line or a curve depending on how the points are arranged on the Scatter Graph.
Examples
| This scatter graph shows a straight line of best fit that crosses through zero showing the variables are directly proportional. | This scatter graph of Extension against Weight results in a straight line of best fit. |
| This scatter graph of Image Distance against Object Distance of a Lens results in a curved line of best fit. | This scatter graph showing how temperature affects enzyme activity results in a curved line of best fit. |


