Distance-Time Graph
Contents
Key Stage 3
Meaning
A distance time graph is a graph that shows how the distance of an object from the origin changes with time.
About Distance Time Graphs
- Distance-time graphs give information about the journey taken by an object.
- On a distance time graph the distance is plotted on the y-axis and the time is plotted on the x-axis.
- A distance time graph can be used to calculate the speed of an object.
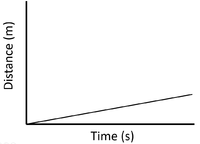
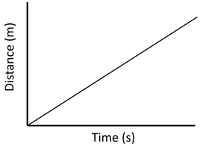
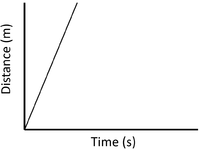
| Slow Speed | Medium Speed | High Speed |
| A constant speed is shown by a constant positive gradient. | A higher gradient means a higher speed. | The highest speed is shown by the steepest gradient. |
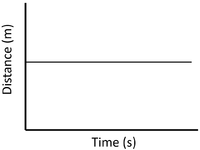
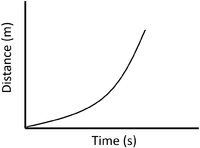
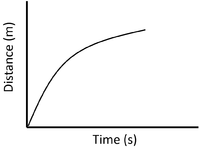
| Stationary | Accelerating | Decelerating |
| A gradient of zero shows the object is not moving. | Acceleration is shown by an increasing gradient. | Deceleration is shown by a decreasing gradient. |
Example Calculations
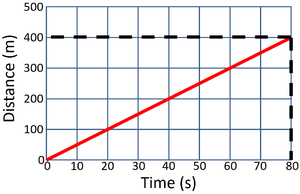
- The speed can be calculated from a distance time graph by reading the graph and using the equation Speed=Distance/Time.
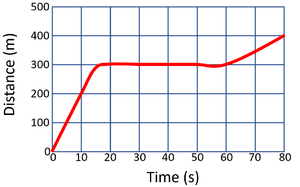
Calculate the speed of the object in this 80 second journey.
\[Speed = {\frac{distance}{time}} \] \[Speed = {\frac{400}{80}} \] \[Speed = 5m/s \] |
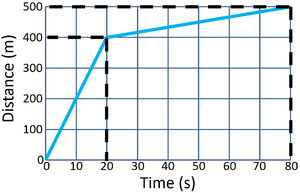
Calculate the speed of the object in the first 20 seconds.
\[Speed = {\frac{distance}{time}} \] \[Speed = {\frac{400}{20}} \] \[Speed = 20m/s \] |
Calculate the speed of the object between 20 and 80 seconds.
\[Speed = {\frac{distance}{time}} \] \[Speed = {\frac{100}{60}} \] \[Speed \approx 1.7m/s \] |
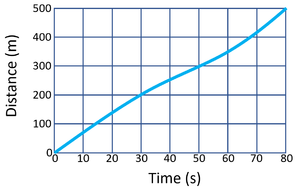
Calculate the average speed of the object for its journey.
\[Speed = {\frac{distance}{time}} \] \[Speed = {\frac{500}{80}} \] \[Speed = 6.25m/s \] |
Key Stage 4
Meaning
A distance time graph is a graph that shows how the distance of an object from the origin changes with time.
About Distance Time Graphs
- Distance-time graphs give information about the journey taken by an object.
- On a distance time graph the distance is plotted on the y-axis and the time is plotted on the x-axis.
- A distance time graph can be used to calculate the speed of an object.
| Slow Speed | Medium Speed | High Speed |
| A constant speed is shown by a constant positive gradient. | A higher gradient means a higher speed. | The highest speed is shown by the steepest gradient. |
| Stationary | Accelerating | Decelerating |
| A gradient of zero shows the object is not moving. | Acceleration is shown by an increasing gradient. | Deceleration is shown by a decreasing gradient. |
Example Calculations
- The speed can be calculated from a distance time graph by reading the graph and using the equation Speed=Distance/Time.
Calculate the speed of the object in the first 10 seconds of the journey.
\[v= {\frac{distance}{time}} \] \[Speed = {\frac{200}{10}} \] \[Speed = 20m/s \] |
Calculate the speed of the object in the first 10 seconds of the journey.
\[Speed = {\frac{distance}{time}} \] \[Speed = {\frac{70}{10}} \] \[Speed = 7m/s \] |
Calculate the average speed of the object over the entire journey.
\[Speed= {\frac{distance}{time}} \] \[Speed = {\frac{400}{80}} \] \[Speed = 5m/s \] |
Calculate the average speed of the object over the entire journey.
\[Speed = {\frac{distance}{time}} \] \[Speed = {\frac{500}{80}} \] \[Speed = 6.25m/s \] |
References
AQA
- Distance-time graph, pages 140, 144-5, GCSE Physics; Student Book, Collins, AQA
- Distance-time graphs, page 210, GCSE Combined Science; The Revision Guide, CGP, AQA
- Distance-time graphs, page 62, GCSE Physics; The Revision Guide, CGP, AQA
- Distance-time graphs, pages 134-135, 140, GCSE Physics; Third Edition, Oxford University Press, AQA
- Distance-time graphs, pages 149-50, GCSE Physics, Hodder, AQA
- Distance-time graphs, pages 152, 153, GCSE Combined Science Trilogy; Physics, CGP, AQA
- Distance-time graphs, pages 183, 184, GCSE Physics; The Complete 9-1 Course for AQA, CGP, AQA
- Distance-time graphs, pages 227-8, GCSE Combined Science Trilogy 2, Hodder, AQA
