Line of Best Fit
Contents
Key Stage 3
Meaning
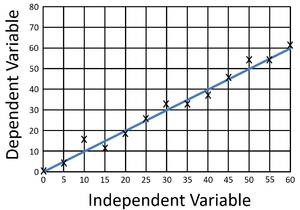
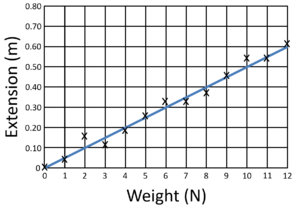
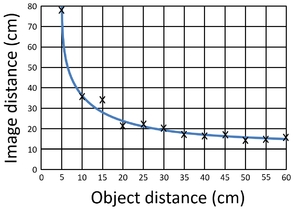
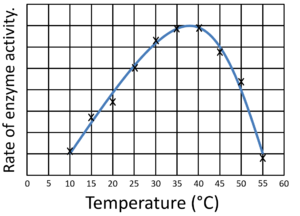
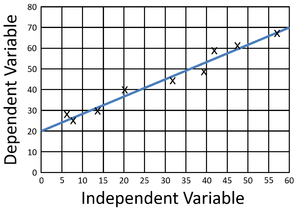
A line of best fit is drawn on a Scatter Graph to fit the trend.
About Lines of Best Fit
- A line of best fit may be a straight line or a curve depending on how the points are arranged on the Scatter Graph.
Examples
| This scatter graph shows a straight line of best fit. | This scatter graph of Extension against Weight results in a straight line of best fit. |
| This scatter graph of Image Distance against Object Distance of a Lens results in a curved line of best fit. | This scatter graph showing how temperature affects enzyme activity results in a curved line of best fit. |
Key Stage 4
Meaning
A line of best fit is drawn on a Scatter Graph to fit the trend.
About Lines of Best Fit
- A line of best fit may be a straight line or a curve depending on how the points are arranged on the Scatter Graph.
Examples
| This scatter graph shows a positive correlation and a straight line of best fit (a linear relationship). | This scatter graph of Extension against Weight results in a straight line of best fit that crosses through zero showing the weight and extension are directly proportional. |
| This scatter graph of Image Distance against Object Distance of a Lens results in a curved line of best fit with a negative correlation that is inversely proportional. | This scatter graph showing how temperature affects enzyme activity results in a curved line of best fit. |
References
AQA
- Line of best fit, page 263, GCSE Physics; Third Edition, Oxford University Press, AQA
- Line of best fit, pages 268-269, GCSE Chemistry; Third Edition, Oxford University Press, AQA
- Lines of best fit (maths skill), pages 40-1, GCSE Physics; Student Book, Collins, AQA
- Lines of best fit, page 7, GCSE Biology; The Revision Guide, CGP, AQA
- Lines of best fit, pages 140, GCSE Combined Science Trilogy 2, Hodder, AQA
Edexcel
- Lines of best fit, page 17, GCSE Physics, CGP, Edexcel
- Lines of best fit, page 18, GCSE Biology, CGP, Edexcel
