Velocity-Time Graph
Contents
Key Stage 4
Meaning
A velocity-time graph is a graph that shows how the velocity of an object changes with time.
About Velocity Time Graphs
- Velocity-time graphs give information about the journey taken by an object.
- On a velocity-time graph the velocity is plotted on the y-axis and the time is plotted on the x-axis.
- A velocity-time graph can be used to calculate the acceleration of an object or the distance travelled by the object.
- The gradient of a velocity-time graph is the same as the acceleration.
- The area under the curve on a velocity-time graph is the distance travelled by an object.
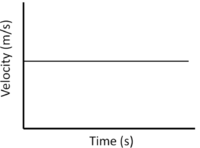
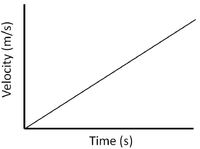
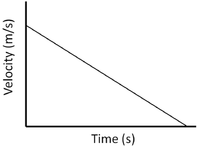
| Constant Velocity | Accelerating | Decelerating |
| A gradient of zero shows the object is travelling at a constant velocity. | Acceleration is shown by a positive gradient. | Deceleration is shown by a negative gradient. |
Example Calculations
Calculating Acceleration
- The acceleration can be calculated from a velocity-time graph by reading the graph and using the equation \(a=\frac{v-u}{t}\).
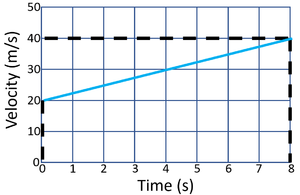
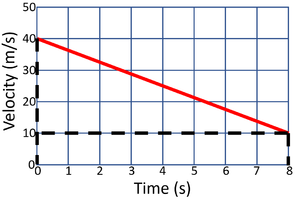
| Calculate the acceleration of the object in this journey. | Calculate the acceleration of the object in this journey. |
| State the known variables.
v = 40m/s u = 20m/s t = 8s |
State the known variables.
v = 10m/s u = 40m/s t = 8s |
| 2. Substitute the numbers into the equation and solve.
\(a = \frac{v-u}{t}\) \(a = \frac{40-20}{8}\) \(a = \frac{20}{8}\) \(a = 2.5m/s/s\) |
2. Substitute the numbers into the equation and solve.
\(a = \frac{v-u}{t}\) \(a = \frac{10-40}{8}\) \(a = \frac{-30}{8}\) \(a = -3.75m/s/s\) |
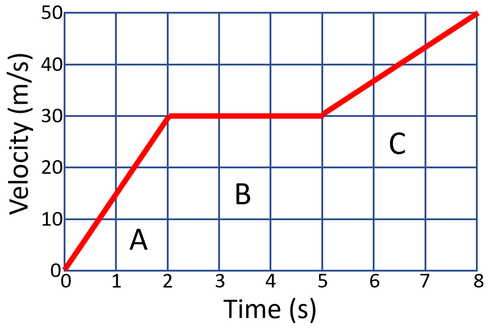
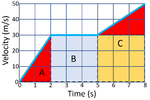
| Calculate the acceleration of the object at each stage in this journey. | ||
| A | B | C |
| State the known variables.
v = 30m/s u = 0m/s t = 2s |
State the known variables.
v = 30m/s u = 30m/s t = 3s |
State the known variables.
v = 50m/s u = 30m/s t = 3s |
| 2. Substitute the numbers into the equation and solve.
\(a = \frac{v-u}{t}\) \(a = \frac{30-0}{2}\) \(a = \frac{30}{2}\) \(a = 15m/s/s\) |
2. Substitute the numbers into the equation and solve.
\(a = \frac{v-u}{t}\) \(a = \frac{30-30}{3}\) \(a = \frac{0}{3}\) \(a = 0m/s/s\) |
2. Substitute the numbers into the equation and solve.
\(a = \frac{v-u}{t}\) \(a = \frac{50-30}{3}\) \(a = \frac{20}{3}\) \(a = 6.7m/s/s\) |
Calculating Distance Travelled
- The distance travelled can be calculated from a velocity-time graph by breaking the graph into simple shapes and finding the area of those shapes. This may use the equations \(area = base \times height\) for rectangular shapes and \(area = \frac{base \times height}{2}\) for triangular shapes.
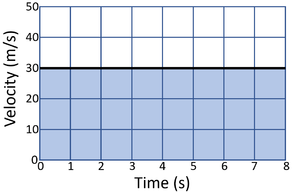
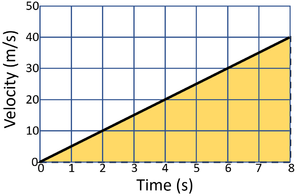
| Calculate the distance travelled by the object in this journey. | Calculate the distance travelled by the object in this journey. |
| 1. State the known quantities
base = 8s height = 30m/s |
1. State the known quantities
base = 8s height = 40m/s |
| 2. Substitute the numbers into the equation and solve.
\(area = b \times h\) \(area = 8 \times 30\) \(area = distance = 250m\) |
2. Substitute the numbers into the equation and solve.
\(area = \frac{b \times h}{2}\) \(area = \frac{8 \times 40}{2}\) \(area = \frac{320}{2}\) \(area = distance = 160m\) |
| Calculate the distance travelled by the object at each stage in this journey. | ||
| A | B | C |
| State the known variables.
b = 2s h = 30m/s |
State the known variables.
b = 3s h = 30m/s |
State the known variables.
b = 3s h1 = 30m/s h2 = 50m/s |
| 2. Substitute the numbers into the equation and solve.
\(area = \frac{b \times h}{2}\) \(area = \frac{2 \times 30}{2}\) \(area = \frac{60}{2}\) \(area = distance = 30m\) |
2. Substitute the numbers into the equation and solve.
\(area = b \times h\) \(area = 3 \times 30\) \(area = distance = 90m\) |
2. Substitute the numbers into the equation and solve.
\(area = b \times h\) \(area = 3 \times 30\) \(area = distance = 90m\) for yellow shaded area. \(area = \frac{b \times h}{2}\) \(area = \frac{3 \times (50-30)}{2}\) \(area = \frac{60}{2}\) \(area = distance = 30m\) for red area. Total distance = 120m |
References
AQA
- Velocity-time graph, pages 148-9, GCSE Physics; Student Book, Collins, AQA
- Velocity-time graphs, page 211, GCSE Combined Science; The Revision Guide, CGP, AQA
- Velocity-time graphs, pages 136, 138-141, GCSE Physics; Third Edition, Oxford University Press, AQA
- Velocity-time graphs, pages 152-3, GCSE Physics, Hodder, AQA
- Velocity-time graphs, pages 155-157, GCSE Combined Science Trilogy; Physics, CGP, AQA
- Velocity-time graphs, pages 186-188, GCSE Physics; The Complete 9-1 Course for AQA, CGP, AQA
- Velocity-time graphs, pages 230-1, 234, GCSE Combined Science Trilogy 2, Hodder, AQA
- Velocity-time graphs, pages 62, 63, GCSE Physics; The Revision Guide, CGP, AQA
- Velocity-time graphs; area under, pages 156, 157, GCSE Combined Science Trilogy; Physics, CGP, AQA
- Velocity-time graphs; area under, pages 187, 188, GCSE Physics; The Complete 9-1 Course for AQA, CGP, AQA
- Velocity-time graphs; for falling objects, page 192, GCSE Physics; The Complete 9-1 Course for AQA, CGP, AQA
