Difference between revisions of "GCSE Biology Required Practical: Osmosis in Plant Tissue"
| Line 40: | Line 40: | ||
:7. Plot a graph showing the concentration of [[sugar]] [[solution]] on the x-axis and the change in [[mass]] of plant tissue on the y-axis. | :7. Plot a graph showing the concentration of [[sugar]] [[solution]] on the x-axis and the change in [[mass]] of plant tissue on the y-axis. | ||
| + | |||
| + | ===References=== | ||
| + | ====Edexcel==== | ||
| + | :[https://www.amazon.co.uk/gp/product/1292120193/ref=as_li_tl?ie=UTF8&camp=1634&creative=6738&creativeASIN=1292120193&linkCode=as2&tag=nrjc-21&linkId=572df39392fb4200db8391d98ae6314e ''Biology core practicals; osmosis in potato slices, pages 22-23, GCSE Combined Science, Pearson Edexcel ''] | ||
Latest revision as of 14:25, 2 November 2019
Contents
Key Stage 4
Meaning
Investigate the effect of the concentration of sugar solution on the mass of plant tissue.
Experiment
Variables
- Independent Variable - The concentration of sugar solution.
- Dependent Variable - The mass of plant tissue at the end.
- Control Variables - Volume of plant tissue. Surface area of plant tissue. Length of time the plant tissue is left in solution. Temperature of the solution.
Method
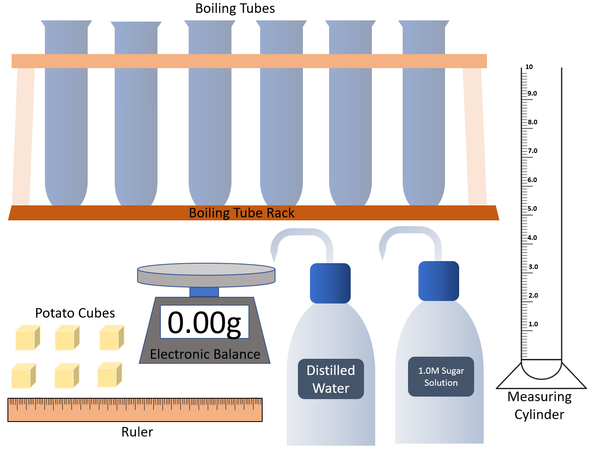
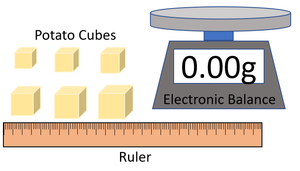
| A diagram of the equipment needed in this experiment. |
|
|
|
- 7. Plot a graph showing the concentration of sugar solution on the x-axis and the change in mass of plant tissue on the y-axis.
