Difference between revisions of "Distance-Time Graph"
| (10 intermediate revisions by 2 users not shown) | |||
| Line 6: | Line 6: | ||
: '''Distance-time graphs''' give information about the journey taken by an [[object]]. | : '''Distance-time graphs''' give information about the journey taken by an [[object]]. | ||
: On a '''distance time graph''' the [[distance]] is plotted on the [[y-axis]] and the [[time]] is plotted on the [[x-axis]]. | : On a '''distance time graph''' the [[distance]] is plotted on the [[y-axis]] and the [[time]] is plotted on the [[x-axis]]. | ||
| − | : A distance time graph can | + | : A '''distance time graph''' can be used to calculate the [[speed]] of an [[object]]. |
{| class="wikitable" | {| class="wikitable" | ||
|- | |- | ||
| Line 36: | Line 36: | ||
===Example Calculations=== | ===Example Calculations=== | ||
| + | : The speed can be calculated from a '''distance time graph''' by reading the graph and using the equation [[Speed=Distance/Time]]. | ||
{| class="wikitable" | {| class="wikitable" | ||
|- | |- | ||
| Line 42: | Line 43: | ||
|- | |- | ||
| style="height:20px; width:300px; text-align:left;" |'''Calculate the speed of the object in this 80 second journey.''' | | style="height:20px; width:300px; text-align:left;" |'''Calculate the speed of the object in this 80 second journey.''' | ||
| − | : distance = | + | : distance = 400m |
| − | : time = | + | : time = 80s |
| − | :<math>Speed = {\ | + | :<math>Speed = {\frac{distance}{time}} </math> |
| − | :<math>Speed = {\ | + | :<math>Speed = {\frac{400}{80}} </math> |
:<math>Speed = 5m/s </math> | :<math>Speed = 5m/s </math> | ||
| style="height:20px; width:300px; text-align:left;" |'''Calculate the speed of the object in the first 20 seconds.''' | | style="height:20px; width:300px; text-align:left;" |'''Calculate the speed of the object in the first 20 seconds.''' | ||
| − | : distance = | + | : distance = 400m |
| − | : time = | + | : time = 20s |
| − | :<math>Speed = {\ | + | :<math>Speed = {\frac{distance}{time}} </math> |
| − | :<math>Speed = {\ | + | :<math>Speed = {\frac{400}{20}} </math> |
:<math>Speed = 20m/s </math> | :<math>Speed = 20m/s </math> | ||
|- | |- | ||
| Line 57: | Line 58: | ||
|[[File:dtGraphCalculation2.png|center|300px]] | |[[File:dtGraphCalculation2.png|center|300px]] | ||
|- | |- | ||
| − | | style="height:20px; width:300px; text-align:left;" |'''Calculate the speed of the object between 20 and 80 seconds''' | + | | style="height:20px; width:300px; text-align:left;" |'''Calculate the speed of the object between 20 and 80 seconds.''' |
| − | : distance = | + | : distance = 100m |
| − | : time = | + | : time = 60s |
| − | :<math>Speed = {\ | + | :<math>Speed = {\frac{distance}{time}} </math> |
| − | :<math>Speed = {\ | + | :<math>Speed = {\frac{100}{60}} </math> |
| − | :<math>Speed | + | :<math>Speed \approx 1.7m/s </math> |
| − | | style="height:20px; width:300px; text-align: | + | | style="height:20px; width:300px; text-align:left;" |'''Calculate the average speed of the object for its journey.''' |
| − | : distance = | + | : distance = 500m |
| − | : time = | + | : time = 80s |
| − | :<math>Speed = {\ | + | :<math>Speed = {\frac{distance}{time}} </math> |
| − | :<math>Speed = {\ | + | :<math>Speed = {\frac{500}{80}} </math> |
:<math>Speed = 6.25m/s </math> | :<math>Speed = 6.25m/s </math> | ||
|} | |} | ||
| + | |||
| + | ==Key Stage 4== | ||
| + | ===Meaning=== | ||
| + | A '''distance time graph''' is a [[graph]] that shows how the [[distance]] of an [[object]] from the [[origin]] changes with [[time]]. | ||
| + | |||
| + | ===About Distance Time Graphs=== | ||
| + | : '''Distance-time graphs''' give information about the journey taken by an [[object]]. | ||
| + | : On a '''distance time graph''' the [[distance]] is plotted on the [[y-axis]] and the [[time]] is plotted on the [[x-axis]]. | ||
| + | : A '''distance time graph''' can be used to calculate the [[speed]] of an [[object]]. | ||
| + | {| class="wikitable" | ||
| + | |- | ||
| + | | style="height:20px; width:200px; text-align:center;" |'''Slow Speed''' | ||
| + | | style="height:20px; width:200px; text-align:center;" |'''Medium Speed''' | ||
| + | | style="height:20px; width:200px; text-align:center;" |'''High Speed''' | ||
| + | |- | ||
| + | |[[File:dtGraphSlowSpeed.png|center|200px]] | ||
| + | |[[File:dtGraphMediumSpeed.png|center|200px]] | ||
| + | |[[File:dtGraphHighSpeed.png|center|200px]] | ||
| + | |- | ||
| + | | style="height:20px; width:200px; text-align:center;" |A constant [[speed]] is shown by a constant positive [[gradient]]. | ||
| + | | style="height:20px; width:200px; text-align:center;" |A higher [[gradient]] means a higher [[speed]]. | ||
| + | | style="height:20px; width:200px; text-align:center;" |The highest [[speed]] is shown by the steepest [[gradient]]. | ||
| + | |- | ||
| + | | style="height:20px; width:200px; text-align:center;" |'''Stationary''' | ||
| + | | style="height:20px; width:200px; text-align:center;" |'''Accelerating''' | ||
| + | | style="height:20px; width:200px; text-align:center;" |'''Decelerating''' | ||
| + | |- | ||
| + | |[[File:dtGraphStationary.png|center|200px]] | ||
| + | |[[File:dtGraphAccelerating.png|center|200px]] | ||
| + | |[[File:dtGraphDecelerating.png|center|200px]] | ||
| + | |- | ||
| + | | style="height:20px; width:200px; text-align:center;" |A [[gradient]] of zero shows the [[object]] is not moving. | ||
| + | | style="height:20px; width:200px; text-align:center;" |[[Acceleration]] is shown by an increasing [[gradient]]. | ||
| + | | style="height:20px; width:200px; text-align:center;" |[[Deceleration]] is shown by a decreasing [[gradient]]. | ||
| + | |} | ||
| + | |||
| + | |||
| + | ===Example Calculations=== | ||
| + | : The speed can be calculated from a '''distance time graph''' by reading the graph and using the equation [[Speed=Distance/Time]]. | ||
| + | {| class="wikitable" | ||
| + | |- | ||
| + | |[[File:dtGraphCalculation4.png|center|300px]] | ||
| + | |[[File:dtGraphCalculation5.png|center|300px]] | ||
| + | |- | ||
| + | | style="height:20px; width:300px; text-align:left;" |'''Calculate the [[speed]] of the object in the first 10 seconds of the journey.''' | ||
| + | : distance = 200m | ||
| + | : time = 10s | ||
| + | :<math>v= {\frac{distance}{time}} </math> | ||
| + | :<math>Speed = {\frac{200}{10}} </math> | ||
| + | :<math>Speed = 20m/s </math> | ||
| + | | style="height:20px; width:300px; text-align:left;" |'''Calculate the [[speed]] of the object in the first 10 seconds of the journey.''' | ||
| + | : distance = 70m | ||
| + | : time = 10s | ||
| + | :<math>Speed = {\frac{distance}{time}} </math> | ||
| + | :<math>Speed = {\frac{70}{10}} </math> | ||
| + | :<math>Speed = 7m/s </math> | ||
| + | |} | ||
| + | |||
| + | {| class="wikitable" | ||
| + | |- | ||
| + | |[[File:dtGraphCalculation4.png|center|300px]] | ||
| + | |[[File:dtGraphCalculation5.png|center|300px]] | ||
| + | |- | ||
| + | | style="height:20px; width:300px; text-align:left;" |'''Calculate the average [[speed]] of the [[object]] over the entire journey.''' | ||
| + | : distance = 400m | ||
| + | : time = 80s | ||
| + | :<math>Speed= {\frac{distance}{time}} </math> | ||
| + | :<math>Speed = {\frac{400}{80}} </math> | ||
| + | :<math>Speed = 5m/s </math> | ||
| + | | style="height:20px; width:300px; text-align:left;" |'''Calculate the average [[speed]] of the [[object]] over the entire journey.''' | ||
| + | : distance = 500m | ||
| + | : time = 80s | ||
| + | :<math>Speed = {\frac{distance}{time}} </math> | ||
| + | :<math>Speed = {\frac{500}{80}} </math> | ||
| + | :<math>Speed = 6.25m/s </math> | ||
| + | |} | ||
| + | |||
| + | |||
| + | ===References=== | ||
| + | ====AQA==== | ||
| + | |||
| + | :[https://www.amazon.co.uk/gp/product/0008158770/ref=as_li_tl?ie=UTF8&camp=1634&creative=6738&creativeASIN=0008158770&linkCode=as2&tag=nrjc-21&linkId=ec31595e720e1529e49876c3866fff6e ''Distance-time graph, pages 140, 144-5, GCSE Physics; Student Book, Collins, AQA ''] | ||
| + | :[https://www.amazon.co.uk/gp/product/1782945598/ref=as_li_tl?ie=UTF8&camp=1634&creative=6738&creativeASIN=1782945598&linkCode=as2&tag=nrjc-21&linkId=ad276ad49df77ab4b40ab4fd0fe09855 ''Distance-time graphs, page 210, GCSE Combined Science; The Revision Guide, CGP, AQA ''] | ||
| + | :[https://www.amazon.co.uk/gp/product/178294558X/ref=as_li_tl?ie=UTF8&camp=1634&creative=6738&creativeASIN=178294558X&linkCode=as2&tag=nrjc-21&linkId=f0dfb66dafcb0c6e9449e7b1a4ae1ac94 ''Distance-time graphs, page 62, GCSE Physics; The Revision Guide, CGP, AQA ''] | ||
| + | :[https://www.amazon.co.uk/gp/product/019835939X/ref=as_li_tl?ie=UTF8&camp=1634&creative=6738&creativeASIN=019835939X&linkCode=as2&tag=nrjc-21&linkId=57e96876985fc39b1a3d8a3e3dc238b6 ''Distance-time graphs, pages 134-135, 140, GCSE Physics; Third Edition, Oxford University Press, AQA ''] | ||
| + | :[https://www.amazon.co.uk/gp/product/1471851370/ref=as_li_tl?ie=UTF8&camp=1634&creative=6738&creativeASIN=1471851370&linkCode=as2&tag=nrjc-21&linkId=01c69b0ae058f809cf636033e6ba793e ''Distance-time graphs, pages 149-50, GCSE Physics, Hodder, AQA ''] | ||
| + | :[https://www.amazon.co.uk/gp/product/1782946403/ref=as_li_tl?ie=UTF8&camp=1634&creative=6738&creativeASIN=1782946403&linkCode=as2&tag=nrjc-21&linkId=32a0abb60dff015b15b50e9b1d7b4644 ''Distance-time graphs, pages 152, 153, GCSE Combined Science Trilogy; Physics, CGP, AQA ''] | ||
| + | :[https://www.amazon.co.uk/gp/product/1782945970/ref=as_li_tl?ie=UTF8&camp=1634&creative=6738&creativeASIN=1782945970&linkCode=as2&tag=nrjc-21&linkId=a120d24dcc7cc7a58192069a3aafc1d2 ''Distance-time graphs, pages 183, 184, GCSE Physics; The Complete 9-1 Course for AQA, CGP, AQA ''] | ||
| + | :[https://www.amazon.co.uk/gp/product/1471851362/ref=as_li_tl?ie=UTF8&camp=1634&creative=6738&creativeASIN=1471851362&linkCode=as2&tag=nrjc-21&linkId=7d78d70a2044ee9982dae010c94af92a ''Distance-time graphs, pages 227-8, GCSE Combined Science Trilogy 2, Hodder, AQA ''] | ||
| + | |||
| + | ====OCR==== | ||
| + | :[https://www.amazon.co.uk/gp/product/1782945695/ref=as_li_tl?ie=UTF8&camp=1634&creative=6738&creativeASIN=1782945695&linkCode=as2&tag=nrjc-21&linkId=ceafcc80bcad6b6754ee97a0c7ceea53 ''Distance-time graphs, page 161, Gateway GCSE Combined Science; The Revision Guide, CGP, OCR ''] | ||
| + | :[https://www.amazon.co.uk/gp/product/1782945687/ref=as_li_tl?ie=UTF8&camp=1634&creative=6738&creativeASIN=1782945687&linkCode=as2&tag=nrjc-21&linkId=9a598e52189317a20311d7a632747bc9 ''Distance-time graphs, page 24, Gateway GCSE Physics; The Revision Guide, CGP, OCR ''] | ||
Latest revision as of 00:40, 5 December 2019
Contents
Key Stage 3
Meaning
A distance time graph is a graph that shows how the distance of an object from the origin changes with time.
About Distance Time Graphs
- Distance-time graphs give information about the journey taken by an object.
- On a distance time graph the distance is plotted on the y-axis and the time is plotted on the x-axis.
- A distance time graph can be used to calculate the speed of an object.
| Slow Speed | Medium Speed | High Speed |
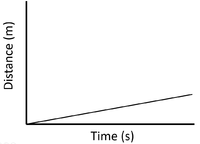
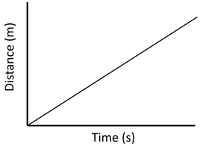
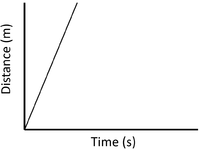
| A constant speed is shown by a constant positive gradient. | A higher gradient means a higher speed. | The highest speed is shown by the steepest gradient. |
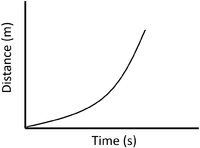
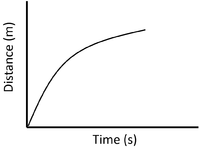
| Stationary | Accelerating | Decelerating |
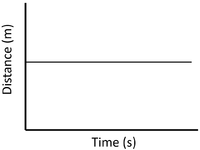
| A gradient of zero shows the object is not moving. | Acceleration is shown by an increasing gradient. | Deceleration is shown by a decreasing gradient. |
Example Calculations
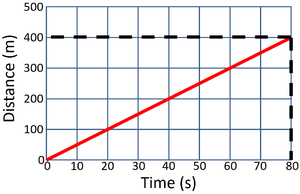
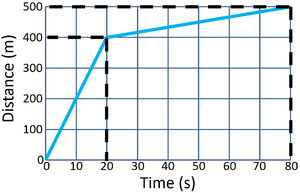
- The speed can be calculated from a distance time graph by reading the graph and using the equation Speed=Distance/Time.
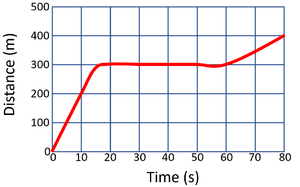
Calculate the speed of the object in this 80 second journey.
\[Speed = {\frac{distance}{time}} \] \[Speed = {\frac{400}{80}} \] \[Speed = 5m/s \] |
Calculate the speed of the object in the first 20 seconds.
\[Speed = {\frac{distance}{time}} \] \[Speed = {\frac{400}{20}} \] \[Speed = 20m/s \] |
Calculate the speed of the object between 20 and 80 seconds.
\[Speed = {\frac{distance}{time}} \] \[Speed = {\frac{100}{60}} \] \[Speed \approx 1.7m/s \] |
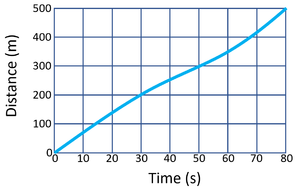
Calculate the average speed of the object for its journey.
\[Speed = {\frac{distance}{time}} \] \[Speed = {\frac{500}{80}} \] \[Speed = 6.25m/s \] |
Key Stage 4
Meaning
A distance time graph is a graph that shows how the distance of an object from the origin changes with time.
About Distance Time Graphs
- Distance-time graphs give information about the journey taken by an object.
- On a distance time graph the distance is plotted on the y-axis and the time is plotted on the x-axis.
- A distance time graph can be used to calculate the speed of an object.
| Slow Speed | Medium Speed | High Speed |
| A constant speed is shown by a constant positive gradient. | A higher gradient means a higher speed. | The highest speed is shown by the steepest gradient. |
| Stationary | Accelerating | Decelerating |
| A gradient of zero shows the object is not moving. | Acceleration is shown by an increasing gradient. | Deceleration is shown by a decreasing gradient. |
Example Calculations
- The speed can be calculated from a distance time graph by reading the graph and using the equation Speed=Distance/Time.
Calculate the speed of the object in the first 10 seconds of the journey.
\[v= {\frac{distance}{time}} \] \[Speed = {\frac{200}{10}} \] \[Speed = 20m/s \] |
Calculate the speed of the object in the first 10 seconds of the journey.
\[Speed = {\frac{distance}{time}} \] \[Speed = {\frac{70}{10}} \] \[Speed = 7m/s \] |
Calculate the average speed of the object over the entire journey.
\[Speed= {\frac{distance}{time}} \] \[Speed = {\frac{400}{80}} \] \[Speed = 5m/s \] |
Calculate the average speed of the object over the entire journey.
\[Speed = {\frac{distance}{time}} \] \[Speed = {\frac{500}{80}} \] \[Speed = 6.25m/s \] |
References
AQA
- Distance-time graph, pages 140, 144-5, GCSE Physics; Student Book, Collins, AQA
- Distance-time graphs, page 210, GCSE Combined Science; The Revision Guide, CGP, AQA
- Distance-time graphs, page 62, GCSE Physics; The Revision Guide, CGP, AQA
- Distance-time graphs, pages 134-135, 140, GCSE Physics; Third Edition, Oxford University Press, AQA
- Distance-time graphs, pages 149-50, GCSE Physics, Hodder, AQA
- Distance-time graphs, pages 152, 153, GCSE Combined Science Trilogy; Physics, CGP, AQA
- Distance-time graphs, pages 183, 184, GCSE Physics; The Complete 9-1 Course for AQA, CGP, AQA
- Distance-time graphs, pages 227-8, GCSE Combined Science Trilogy 2, Hodder, AQA
