Difference between revisions of "Velocity-Time Graph"
(→Example Calculations) |
(→Example Calculations) |
||
| Line 29: | Line 29: | ||
{| class="wikitable" | {| class="wikitable" | ||
|- | |- | ||
| − | |[[File: | + | |[[File:vtGraphCalculateAcceleration1.png|center|300px]] |
| − | |[[File: | + | |[[File:vtGraphCalculateAcceleration2.png|center|300px]] |
|- | |- | ||
| − | | style="height:20px; width:300px; text-align:left;" |'''Calculate the [[acceleration]] of the object in | + | | style="height:20px; width:300px; text-align:left;" |'''Calculate the [[acceleration]] of the object in this journey.''' |
| − | | style="height:20px; width:300px; text-align:left;" |'''Calculate the [[acceleration]] of the object in | + | | style="height:20px; width:300px; text-align:left;" |'''Calculate the [[acceleration]] of the object in this journey.''' |
|} | |} | ||
| Line 42: | Line 42: | ||
{| class="wikitable" | {| class="wikitable" | ||
|- | |- | ||
| − | |[[File: | + | |[[File:vtGraphCalculateArea1.png|center|300px]] |
| − | |[[File: | + | |[[File:vtGraphCalculateArea2.png|center|300px]] |
|- | |- | ||
| − | | style="height:20px; width:300px; text-align:left;" |'''Calculate the [[distance]] travelled by the [[object]] in | + | | style="height:20px; width:300px; text-align:left;" |'''Calculate the [[distance]] travelled by the [[object]] in this journey.''' |
| − | | style="height:20px; width:300px; text-align:left;" |'''Calculate the [[distance]] travelled by the [[object]] | + | | style="height:20px; width:300px; text-align:left;" |'''Calculate the [[distance]] travelled by the [[object]] in this journey.''' |
|} | |} | ||
Revision as of 12:42, 14 February 2019
Contents
Key Stage 4
Meaning
A velocity-time graph is a graph that shows how the velocity of an object changes with time.
About Velocity Time Graphs
- Velocity-time graphs give information about the journey taken by an object.
- On a velocity-time graph the velocity is plotted on the y-axis and the time is plotted on the x-axis.
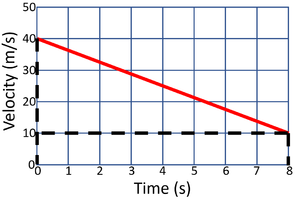
- A velocity-time graph can be used to calculate the acceleration of an object or the distance travelled by the object.
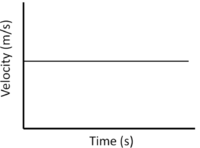
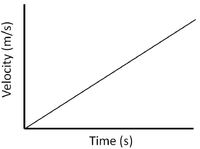
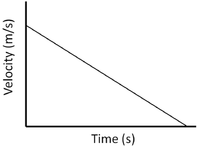
- The gradient of a velocity-time graph is the same as the acceleration.
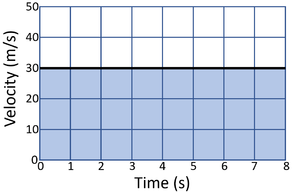
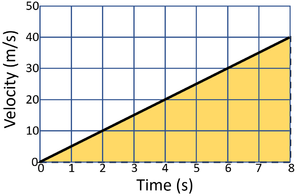
- The area under the curve on a velocity-time graph is the distance travelled by an object.
| Constant Velocity | Accelerating | Decelerating |
| A gradient of zero shows the object is travelling at a constant velocity. | Acceleration is shown by a positive gradient. | Deceleration is shown by a negative gradient. |
Example Calculations
Calculating Acceleration
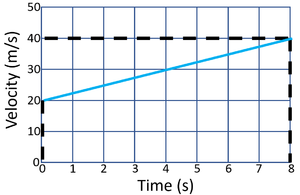
- The acceleration can be calculated from a velocity-time graph by reading the graph and using the equation \(a=\frac{v-u}{t}\).
| Calculate the acceleration of the object in this journey. | Calculate the acceleration of the object in this journey. |
Calculating Distance Travelled
- The distance travelled can be calculated from a velocity-time graph by breaking the graph into simple shapes and finding the area of those shapes. This may use the equations \(a = b \times h\) for rectangular shapes and \(a = \frac{b \times h}{2}\) for triangular shapes.
| Calculate the distance travelled by the object in this journey. | Calculate the distance travelled by the object in this journey. |
