Key Stage 3
Meaning
A distance time graph is a graph that shows how the distance of an object from the origin changes with time.
About Distance Time Graphs
- Distance-time graphs give information about the journey taken by an object.
- A distance time graph can show the speed of an object.
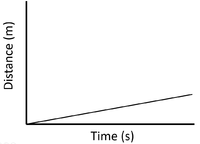
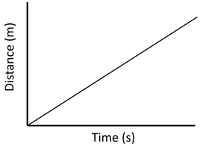
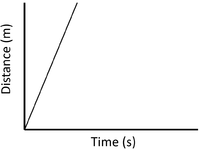
| Slow Speed | Medium Speed | High Speed |
| A constant speed is shown by a constant positive gradient. | A higher gradient means a higher speed. | The highest speed is shown by the steepest gradient. |
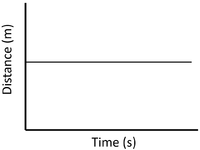
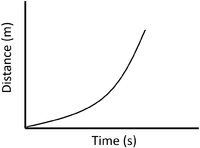
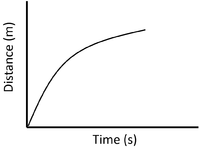
| Stationary | Accelerating | Decelerating |
| A gradient of zero shows the object is not moving. | Acceleration is shown by an increasing gradient. | Deceleration is shown by a decreasing gradient. |
