Gradient
Contents
Key Stage 3
Meaning
Gradient is how steep or shallow a line is compared to the horizontal.
About Gradient
- The gradient of a slope is how much the height increases as the horizontal distance increases. A steep slope has a large increase in height over a short horizontal distance.
- The gradient on a scatter graph is the rate at which the variable on the y-axis changes with a change on the x-axis.
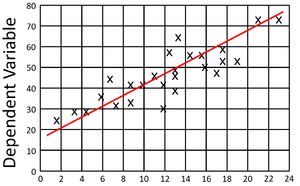
- A positive gradient on a scatter graph is one where as x increases, y increases.
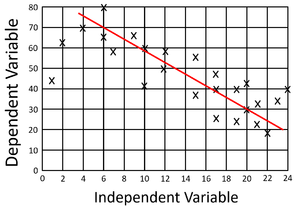
- A negative gradient on a scatter graph in one where as x increases, y decreases.
Equation
Gradient = (Change in y)/(Change in x)
\(m=\frac{y_2-y_1}{x_2-x_1}\)
Where\[m\] = The gradient.
\(y_2\) = The final y value.
\(y_1\) = The initial y value.
\(x_2\) = The final x value.
\(x_2\) = The initial x value.
Examples
| This scatter graph shows a positive gradient. | This scatter graph shows a negative gradient. |
Key Stage 4
Meaning
Gradient is how steep or shallow a line is compared to the horizontal.
About Gradient
- The gradient of a slope is how much the height increases as the horizontal distance increases. A steep slope has a large increase in height over a short horizontal distance.
- The gradient on a scatter graph is the rate at which the variable on the y-axis changes with a change on the x-axis.
- A positive gradient on a scatter graph is one where as x increases, y increases.
- A negative gradient on a scatter graph in one where as x increases, y decreases.
Equation
Gradient = (Change in y)/(Change in x)
\(m=\frac{y_2-y_1}{x_2-x_1}\)
Where\[m\] = The gradient.
\(y_2\) = The final y value.
\(y_1\) = The initial y value.
\(x_2\) = The final x value.
\(x_2\) = The initial x value.
| This scatter graph shows a positive gradient. | This scatter graph shows a negative gradient. |
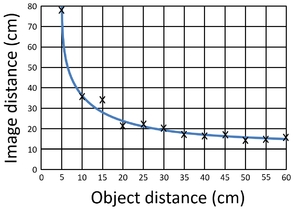
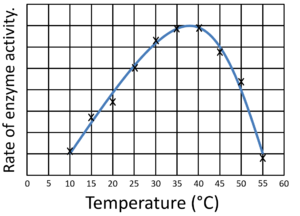
| This scatter graph of Image Distance against Object Distance of a Lens begins with a steep negative gradient which becomes more shallow until the gradient is almost zero. | This scatter graph showing how temperature affects enzyme activity begins with a steep positive gradient but then changes to a steep negative gradient. |


