Key Stage 3
Meaning
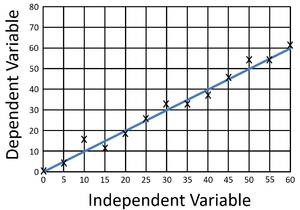
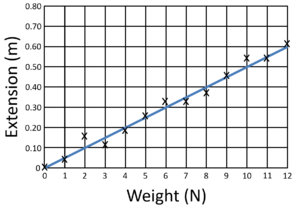
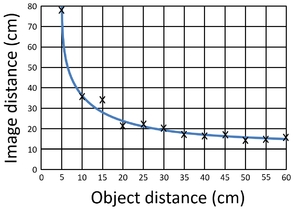
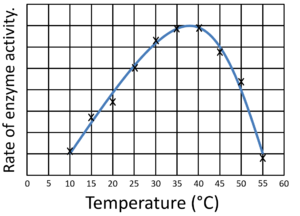
A line of best fit is drawn on a Scatter Graph to fit the trend.
About Lines of Best Fit
- A line of best fit may be a straight line or a curve depending on how the points are arranged on the Scatter Graph.
Examples
| This scatter graph shows a straight line of best fit. | This scatter graph shows a straight line of best fit. |
| This scatter graph shows a curved line of best fit. | This scatter graph shows a curved line of best fit. |


