Key Stage 5
Meaning
A Feynman diagram is a type of graph used to represent the interactions between subatomic particles.
About Feynman Diagrams
- Feynman diagrams have time on the y-axis and space on the z-axis.
- Feynman diagrams are used to simplify complex equations used to represent subatomic particle interactions.
Examples
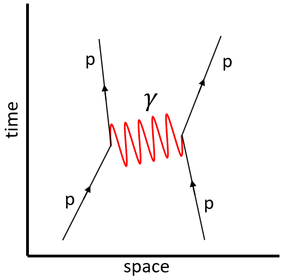
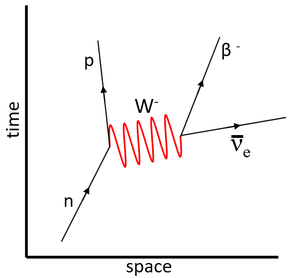
| This Feynman diagram shows the electromagnetic interaction between two protons via the virtual photon. | This Feynman diagram shows the weak interaction in which a neutron decays into a proton.
\(n \rightarrow p + \beta^- + \bar\nu_e\) |
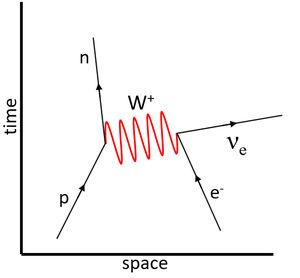
| This Feynman diagram shows the weak interaction in which a proton captures an electron to become a neutron.
\(p + e^- \rightarrow n + \nu_e\) |
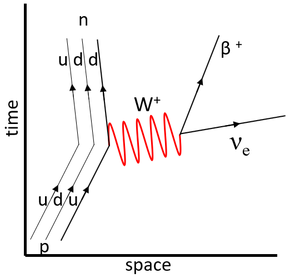
This Feynman diagram shows the weak interaction in which an up-quark decays into a down-quark, which is observed as a proton decaying into a neutron via beta emission.
\(u \rightarrow d + \beta^+ + \nu_e\) |


