Difference between revisions of "Linear"
(→Examples) |
|||
| Line 14: | Line 14: | ||
|[[File:DirectlyProportionalSketchGraph.png|center|200px]] | |[[File:DirectlyProportionalSketchGraph.png|center|200px]] | ||
|- | |- | ||
| − | | style="height:20px; width:200px; text-align:center;" |This [[Scatter Graph|scatter graph]] shows a [[linear]] relationship | + | | style="height:20px; width:200px; text-align:center;" |This [[Scatter Graph|scatter graph]] shows a [[linear]] relationship where x increases and y increases. |
<math>y = mx + c</math> | <math>y = mx + c</math> | ||
Where m, the [[gradient]], is positive. | Where m, the [[gradient]], is positive. | ||
| − | | style="height:20px; width:200px; text-align:center;" |This [[Scatter Graph|scatter graph]] shows a [[linear]] relationship | + | | style="height:20px; width:200px; text-align:center;" |This [[Scatter Graph|scatter graph]] shows a [[linear]] relationship where x increases and y decreases. |
<math>y = mx + c</math> | <math>y = mx + c</math> | ||
Revision as of 15:29, 5 December 2021
Key Stage 4
Meaning
Linear refers to a straight line.
About Linearity
- A scatter graph with a straight line of best fit is referred to as a linear graph.
- A linear graph has a constant gradient.
Examples
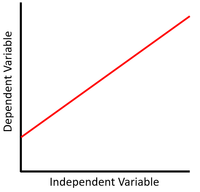
| This scatter graph shows a linear relationship where x increases and y increases.
\(y = mx + c\) Where m, the gradient, is positive. |
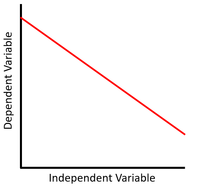
This scatter graph shows a linear relationship where x increases and y decreases.
\(y = mx + c\) Where m, the gradient, is negative. |
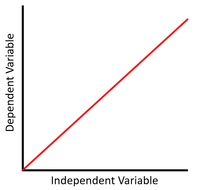
This scatter graph shows a linear relationship that is directly proportional where x doubles, y doubles.
\(y = mx\) Where m, the gradient, is positive. |


