Linear Graph
Key Stage 4
Meaning
When a relationship between two variables is linear they increase by a constant amount in relation to one another.
About Proportional Graphs
- A scatter graph showing a linear relationship has straight line of best fit.
- On a proportional scatter graph when one variable increases, the other increase or when one increases the other decreases.
- A proportional graph may have a non-zero y-intercept.
- If the line of best fit has a y-intercept of zero then it is called 'directly proportional'.
Examples
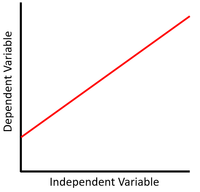
| This scatter graph shows a linear relationship that is proportional where x increases, y increases.
\(y = mx + c\) Where m, the gradient, is positive. |
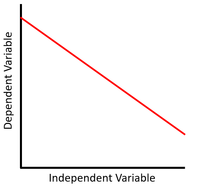
This scatter graph shows a linear relationship that is proportional where x increases, y decreases.
\(y = mx + c\) Where m, the gradient, is negative. |
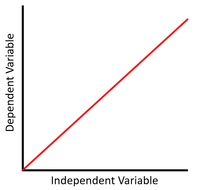
This scatter graph shows a linear relationship that is directly proportional where x doubles, y doubles.
\(y = mx\) Where m, the gradient, is positive. |


