Difference between revisions of "Feynman Diagram"
(→Constructing a Feynman Diagram) |
(→Constructing a Feynman Diagram) |
||
| Line 18: | Line 18: | ||
<math>p + e^- \rightarrow n + \bar\nu_e</math> | <math>p + e^- \rightarrow n + \bar\nu_e</math> | ||
| style="height:20px; width:200px; text-align:center;" | | | style="height:20px; width:200px; text-align:center;" | | ||
| − | <math>p + e^- \ | + | <math>p + e^- \xrightarrow{W^+} n + \bar\nu_e</math> |
|- | |- | ||
|[[File:FeynmanDiagramElectronCapturePt1.png|center|200px]] | |[[File:FeynmanDiagramElectronCapturePt1.png|center|200px]] | ||
| Line 36: | Line 36: | ||
<math>n \rightarrow p + \beta^- + \bar\nu_e</math> | <math>n \rightarrow p + \beta^- + \bar\nu_e</math> | ||
| style="height:20px; width:200px; text-align:center;" | | | style="height:20px; width:200px; text-align:center;" | | ||
| − | <math>n \ | + | <math>n \xrightarrow{W^-} p + \beta^- + \bar\nu_e</math> |
|- | |- | ||
|[[File:FeynmanDiagramNeutronDecayPt1.png|center|200px]] | |[[File:FeynmanDiagramNeutronDecayPt1.png|center|200px]] | ||
Revision as of 19:11, 31 July 2019
Contents
Key Stage 5
Meaning
A Feynman diagram is a type of graph used to represent the interactions between subatomic particles.
About Feynman Diagrams
- Feynman diagrams have time on the y-axis and space on the z-axis.
- Feynman diagrams are used to simplify complex equations used to represent subatomic particle interactions.
- Particles with a high velocity are seen as having shallow gradients on a Feynman diagram since they travel a large distance in space over a short duration of time.
Constructing a Feynman Diagram
- Feynman Diagrams can be constructed from the equations representing a particle interaction.
- The particles at the start of the equation are written at the bottom of the Feynman diagram while the products are written at the top.
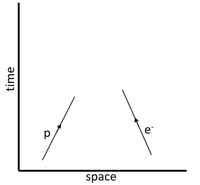
|
\(p + e^-\) |
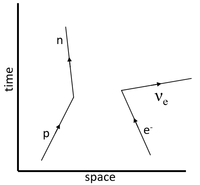
\(p + e^- \rightarrow n + \bar\nu_e\) |
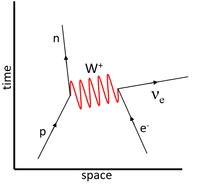
\(p + e^- \xrightarrow{W^+} n + \bar\nu_e\) |
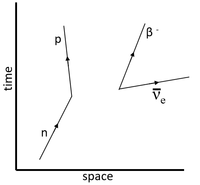
| The particles prior to the interaction are drawn first at the bottom of the Feynman diagram. | The particles after the interaction are drawn at the top of the Feynman diagram. It should be recognised that baryon conservation means a baryon becomes another baryon and lepton conservation means that a lepton is transformed from one type of lepton into another. | Finally the boson mediating the interaction is added as a wave between the two points of interaction. In this case a proton loses its positive charge therefore it is carried away to the electron via the W+ boson transforming the electron into an electron-neutrino. |
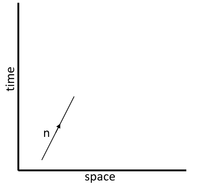
|
\(n \rightarrow\) |
\(n \rightarrow p + \beta^- + \bar\nu_e\) |
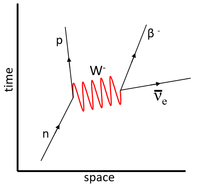
\(n \xrightarrow{W^-} p + \beta^- + \bar\nu_e\) |
| The particles prior to the interaction are drawn first at the bottom of the Feynman diagram. | The particles after the interaction are drawn at the top of the Feynman diagram. It should be recognised that baryon conservation means a baryon becomes another baryon and lepton conservation means that if a lepton comes into existence there must also be an antilepton. | Finally the boson mediating the interaction is added as a wave between the two points of interaction. In this case a proton loses its positive charge therefore it is carried away to the electron via the W+ boson transforming the electron into an electron-neutrino. |
Examples
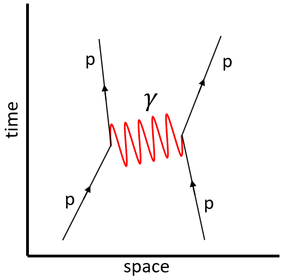
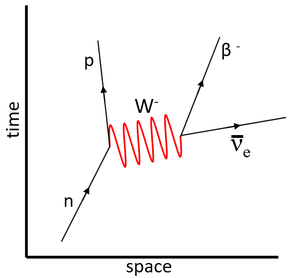
| This Feynman diagram shows the electromagnetic interaction between two protons via the virtual photon. | This Feynman diagram shows the weak interaction in which a neutron decays into a proton.
\(n \rightarrow p + \beta^- + \bar\nu_e\) |
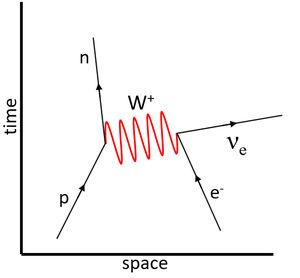
| This Feynman diagram shows the weak interaction in which a proton captures an electron to become a neutron.
\(p + e^- \rightarrow n + \nu_e\) |
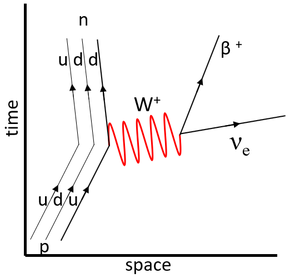
This Feynman diagram shows the weak interaction in which an up-quark decays into a down-quark, which is observed as a proton decaying into a neutron via beta emission.
\(u \rightarrow d + \beta^+ + \nu_e\) |
