Difference between revisions of "Emission Spectra"
| Line 11: | Line 11: | ||
{| class="wikitable" | {| class="wikitable" | ||
|- | |- | ||
| − | |[[File:Emission.png|center| | + | |[[File:Emission.png|center|500px]] |
|- | |- | ||
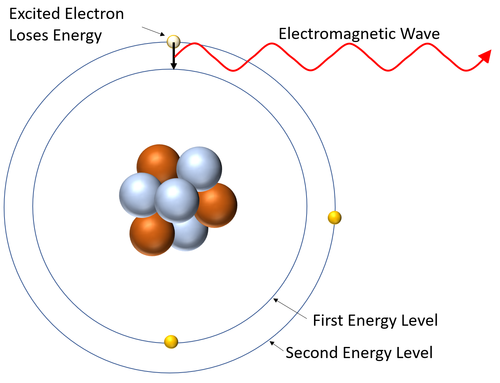
| style="height:20px; width:200px; text-align:center;" |This [[diagram]] shows an [[excited]] [[electron]] losing [[energy]] by [[emit]]ting an [[Electromagnetic Wave|electromagnetic wave]]. As it does this the [[electron]] falls back down to a lower [[Energy Level|energy level]]. | | style="height:20px; width:200px; text-align:center;" |This [[diagram]] shows an [[excited]] [[electron]] losing [[energy]] by [[emit]]ting an [[Electromagnetic Wave|electromagnetic wave]]. As it does this the [[electron]] falls back down to a lower [[Energy Level|energy level]]. | ||
|} | |} | ||
Revision as of 13:13, 22 February 2019
Key Stage 4
Meaning
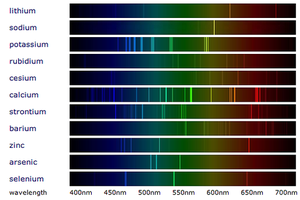
Emission spectra are the specific wavelengths of light emitted by the electrons in atoms as they lose energy.
About Emission Spectra
- The spectrum of white light is a continuous change of colours with all wavelengths having the same intensity.
- An emission spectrum is a set of specific wavelengths with a high intensity. This appears as bright lines of colour on a spectrum.
- A emission spectrum is created when excited electrons (electrons in high energy levels) lose energy and fall to a lower energy level emitting a specific wavelength of electromagnetic wave when they do.
| This diagram shows an excited electron losing energy by emitting an electromagnetic wave. As it does this the electron falls back down to a lower energy level. |

