GCSE Physics Required Practical: Investigating Electrical Components
Contents
Key Stage 4
Meaning
Investigate the I-V characteristics of electrical components.
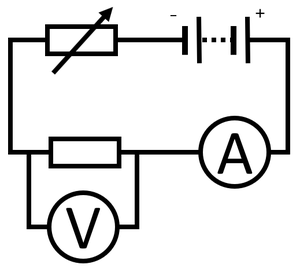
Experiment 1a: Resistor
Variables
- Independent Variable: The potential difference across the resistor.
- Dependent Variable: The current through the resistor
Method
|
Improving Precision
- Use the same component for each repeat. Do not just use the same value of component as they may be slightly different from one another.
- Use a low current and turn the circuit off between readings. This prevents the wires and components increasing in temperature which would increase resistance and affect future readings including repeat readings.
Results
Conclusion
Description
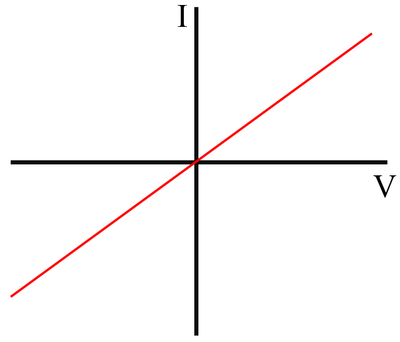
The IV Graph for a resistor shows that:
- As potential difference increases, increases.
- The relationship between potential difference and current is linear (the gradient is constant).
- The current is directly proportional to potential difference.
Explanation
- Resistors obey Ohm's Law so the "current through a resistor at constant temperature is directly proportional to the potential difference across the resistor."
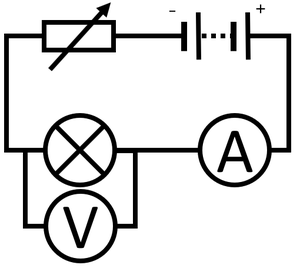
Experiment 1b: Filament Bulb
Variables
- Independent Variable: The potential difference across the bulb.
- Dependent Variable: The current through the bulb
Method
|
Improving Precision
- Use the same component for each repeat. Do not just use the same value of component as they may be slightly different from one another.
- Use a low current and turn the circuit off between readings. This prevents the wires and components increasing in temperature which would increase resistance and affect future readings including repeat readings.
Results
Conclusion
Description
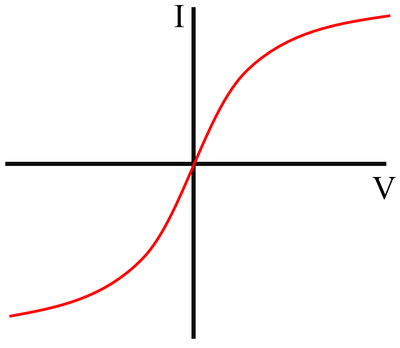
The IV Graph for a bulb shows that:
- As potential difference increases, increases.
- At small potential differences] the the relationship between potential difference and current is linear (the gradient is constant).
- At large potential differences the gradient becomes more shallow as the resistance of the bulb increases.
Explanation
- At small potential differences there is a small current so the heating effect of the current is small and the filament remains at a low temperature.
- At large potential differences there is a large electrical current so the heating effect of the current is large which causes the filament to be a high temperature.
- Wires (like the filament) have a greater resistance at higher temperatures, causing the increase in current to be reduced.
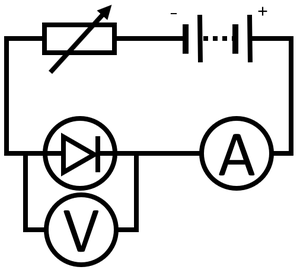
Experiment 1c: Diode or LED
Variables
- Independent Variable: The potential difference across the diode.
- Dependent Variable: The current through the diode
Method
|
Improving Precision
- Use the same component for each repeat. Do not just use the same value of component as they may be slightly different from one another.
- Use a low current and turn the circuit off between readings. This prevents the wires and components increasing in temperature which would increase resistance and affect future readings including repeat readings.
Results
Conclusion
Description
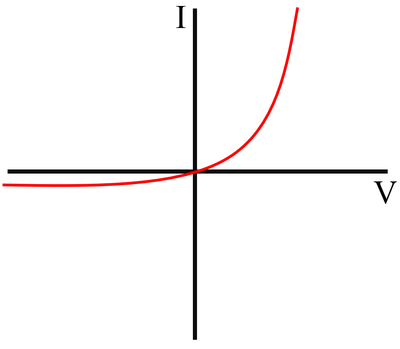
The IV Graph for a diode shows that:
- For a positive potential difference the current increases rapidly with an increase in potential difference
- For a negative potential difference the current remains negligible and does not increase as the potential difference becomes larger.
Explanation
- The resistance of a diode is very low for current in the forward direction and very high in the back direction.
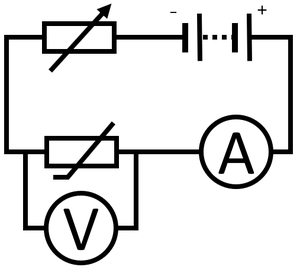
Experiment 1d: 'NTC' Thermistor
Variables
- Independent Variable: The potential difference across the thermistor.
- Dependent Variable: The current through the thermistor
Method
|
Improving Precision
- Use the same component for each repeat. Do not just use the same value of component as they may be slightly different from one another.
- Use a low current and turn the circuit off between readings. This prevents the wires and components increasing in temperature which would increase resistance and affect future readings including repeat readings.
Results
Conclusion
Description
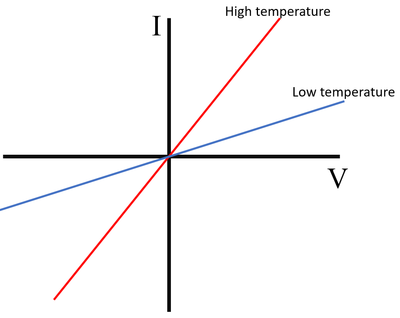
The IV Graph for an 'NTC' thermistor shows that:
- At a high temperature the current increases rapidly with the potential difference
- At a low temperature the current increases slowly with the potential difference.
Explanation
- The resistance of an 'NTC' thermistor increases as the temperature decreases.
Experiment 1a: Resistor
Variables
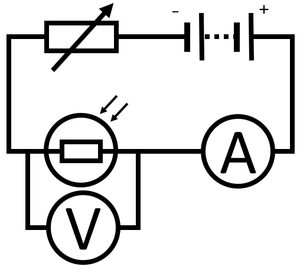
- Independent Variable: The potential difference across the light dependent resistor.
- Dependent Variable: The current through the light dependent resistor
Method
|
Improving Precision
- Use the same component for each repeat. Do not just use the same value of component as they may be slightly different from one another.
- Use a low current and turn the circuit off between readings. This prevents the wires and components increasing in temperature which would increase resistance and affect future readings including repeat readings.
Results
Conclusion
Description
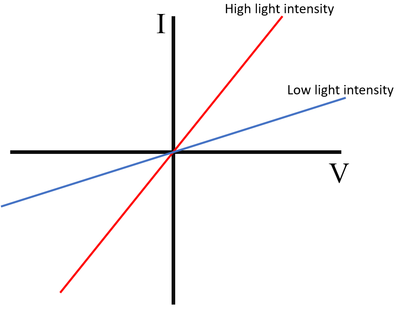
The IV Graph for a light dependent resistor shows that:
- At a high light intensity the current increases rapidly with the potential difference
- At a low light intensity the current increases slowly with the potential difference.
Explanation
- The resistance of an LDR increases as the light intensity decreases.
